# Structure the Data
To remind you of the task at hand and what output we expect:
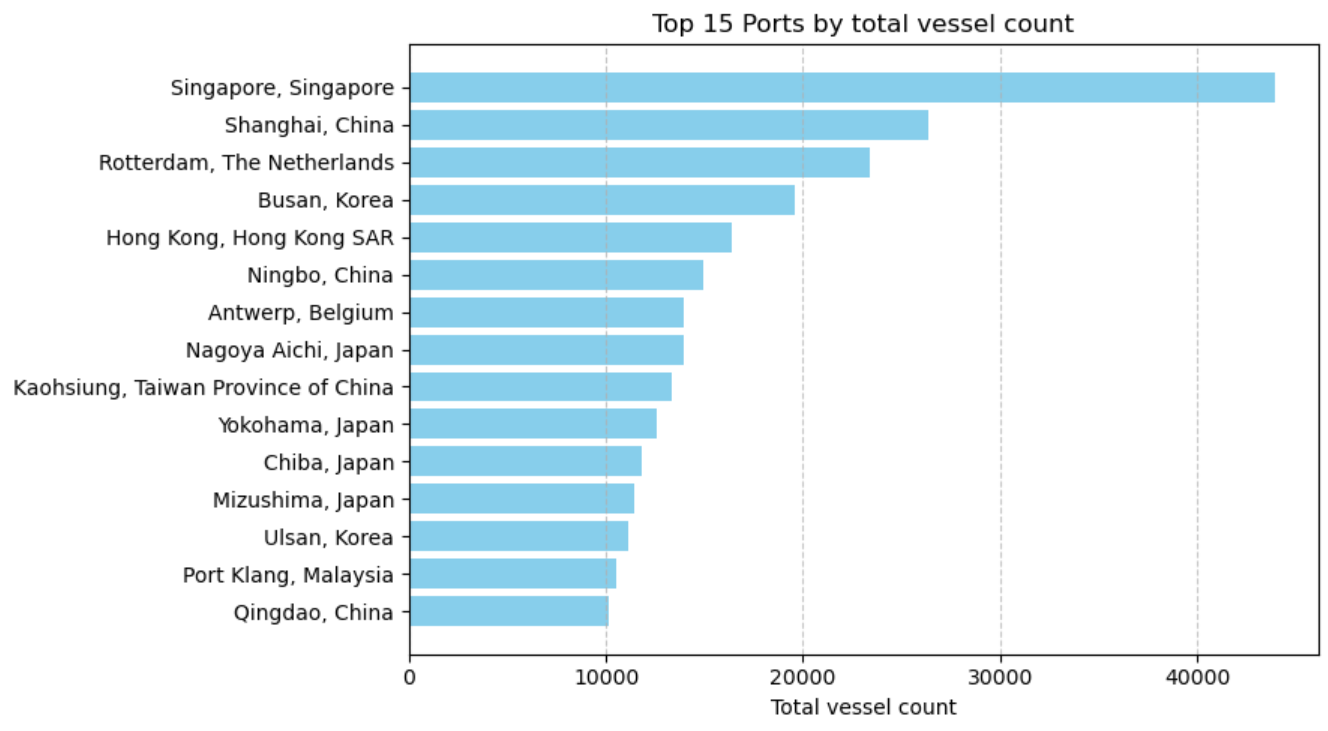
* [ ] Plot the top 15 significant ports, by using the total amount of vessels handled by the port. The resulting diagram should look something like this:
* [ ] Give us an extract of your table and explain what you observe. Notice that we haven't cleaned the dataset yet, do you notice any issues with the data already?
* [ ] 🤔 Let us know what your thought process is, and extensively comment your code!
>
>
> To sort the rows you need `.sort_values()`, additionally you need to set the `by` and `ascending` parameters to specify the column to sort by and whether to sort in ascending order or not.
>
> To get the top *n* rows you can use `.head(n)`.
 >
> To sort the rows you need `.sort_values()`, additionally you need to set the `by` and `ascending` parameters to specify the column to sort by and whether to sort in ascending order or not.
>
> To get the top *n* rows you can use `.head(n)`.
>
> To sort the rows you need `.sort_values()`, additionally you need to set the `by` and `ascending` parameters to specify the column to sort by and whether to sort in ascending order or not.
>
> To get the top *n* rows you can use `.head(n)`.